CPUID HWMonitor is a popular system monitoring and hardware diagnostic tool that allows users to monitor various hardware components of their computer. It provides real-time information about the temperature, voltage, fan speed, and other important parameters of your system's hardware components...
Here are some of the features of HWMonitor:
Real-time Monitoring: HWMonitor provides real-time monitoring of various hardware sensors, including CPU temperature, GPU temperature, fan speeds, voltage levels, and more. This information can be crucial for diagnosing hardware issues or ensuring that your system is running within safe temperature and voltage ranges.
Compatibility: It supports a wide range of hardware components, including CPUs, GPUs, hard drives, SSDs, motherboards, and more. This makes it suitable for monitoring both desktop and laptop systems.
Customizable Interface: HWMonitor offers a customizable interface that allows users to select which sensors and components they want to monitor. This makes it easy to focus on the specific hardware information that matters to you.
Logging and Alerts: Users can log sensor data over time, which can be useful for tracking hardware performance or identifying issues that occur intermittently. It also supports customizable alerts that can notify you when temperatures or other parameters exceed a predefined threshold.
Sensor History: The software keeps a history of sensor readings, which can help you identify trends in your system's performance or temperature changes over time.
Portable Version: HWMonitor offers a portable version that doesn't require installation, making it convenient for use on different computers without leaving traces in the system registry.
Minimize to System Tray: You can minimize HWMonitor to the system tray, allowing you to keep an eye on your system's hardware without cluttering your desktop.
Free and Paid Versions: CPUID HWMonitor offers both a free and a paid Pro version. The Pro version includes additional features such as remote monitoring and more advanced alert options.
Overall, HWMonitor is a powerful and versatile hardware monitoring software that is a must-have for any PC enthusiast.
Here are some of the pros of using HWMonitor:
Ease of Use: HWMonitor is user-friendly and doesn't require advanced technical knowledge to use effectively. Its simple and intuitive interface makes it accessible to users of all skill levels.
Comprehensive Hardware Monitoring: It provides a comprehensive overview of your system's hardware health, allowing you to identify potential issues before they become serious problems.
Resource Efficiency: HWMonitor is lightweight and doesn't consume significant system resources while running in the background. It can be left running without affecting your computer's performance.
Compatibility: Its wide range of supported hardware components ensures that it can be used on various systems without compatibility issues.
Customization: The ability to customize the monitoring interface and set up alerts according to your preferences provides a tailored experience.
Historical Data: The ability to log and review historical sensor data helps in diagnosing intermittent issues and tracking hardware performance over time.
Portable Version: The portable version is convenient for technicians or users who need to monitor hardware on multiple computers without installing software on each one.
In summary, CPUID HWMonitor is a versatile and user-friendly hardware monitoring tool that provides real-time data about your computer's hardware components. It's a valuable utility for system maintenance, troubleshooting, and ensuring your hardware is running optimally while being lightweight and resource-efficient.
CPUID HWMonitor - Changelog:
AMD Ryzen 9 9950X (16C/32T), 9900X (12C/24T), Ryzen 7 9700X (8C/16T) and Ryzen 5 9600X (6C/12T) Granite Ridge (Zen 5).
AMD Ryzen AI 9 HX 375 (4x Zen 5 + 8x Zen 5c), Ryzen AI 9 365 (4x Zen 5 + 6x Zen 5c) Strix Point APUs.
AMD Ryzen 9 8945H, Ryzen 7 8845HS (Hawk Point).
Intel Core Ultra 9 285K & 275, Core Ultra 7 265K & 255, Core Ultra 5 245K & 240 (Arrow Lake).
Intel Core Ultra 9 288V ; Ultra 7 268V, 266V, 258V, 256V ; Ultra 5 236V, 228V, 2266V (Lunar Lake).
AMD Radeon RX 7600 XT (Navi 33 XT).
How to use CPUID HWMonitor:
Using CPUID HWMonitor is straightforward and user-friendly. Here are the steps to use the software to monitor your computer's hardware:
1. Download and Install:
- Download the installer for your system (32-bit or 64-bit) and run it.
- Follow the on-screen instructions to install the software. You can choose to install the free version or the Pro version if you have a license.
2. Launch HWMonitor:
- After installation, launch HWMonitor from the Start menu or desktop shortcut.
3. Monitor Hardware:
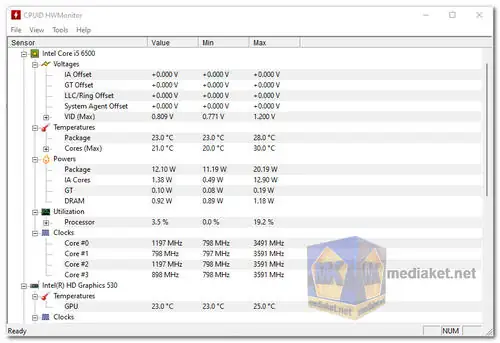
- Once HWMonitor is running, it will automatically start detecting and displaying real-time information about your hardware components. You will see a list of sensors and their respective values.
4. Customize Monitoring (Optional):
- If you want to customize what you're monitoring or set up alerts, click on the "Options" menu and select "Configure."
- In the Configuration window, you can choose which sensors to display, set up sensor history logging, and configure alert notifications. Adjust these settings according to your preferences.
5. View Historical Data (Optional):
- To view historical data for your sensors, click on the "View" menu and select "Show Plot." This will display a graph showing the history of selected sensors over time.
6. Minimize to System Tray (Optional):
- If you want to keep HWMonitor running in the background, you can minimize it to the system tray by clicking the minimize button (—) in the top-right corner of the window.
7. Exit HWMonitor:
- To close HWMonitor, click the "X" button in the top-right corner of the window or right-click the HWMonitor icon in the system tray and select "Exit."
That's it! You are now using CPUID HWMonitor to monitor your computer's hardware. The software will continuously update the sensor readings in real-time, allowing you to keep an eye on the temperature, voltage, and other important parameters of your system. You can use this information for various purposes, such as monitoring system health, diagnosing hardware issues, or ensuring your hardware is operating within safe ranges.