
GraphPad Prism is a powerful and widely used statistical and scientific graphing software designed for researchers, scientists, and analysts in various fields such as biology, pharmacology, and other life sciences. It provides a comprehensive suite of tools for data analysis, visualization, and presentation, making it an essential tool for professionals conducting experiments and studies...
Key Features of GraphPad Prism:
Data Import and Organization:
Import data seamlessly from various sources, including Excel, CSV, and other spreadsheet formats.
Easily organize and manage experimental data sets for efficient analysis.
Statistical Analysis:
Conduct a wide range of statistical analyses, including t-tests, ANOVA, regression, non-linear regression, and more.
Generate descriptive statistics and perform statistical tests to assess the significance of experimental results.
Graphing and Visualization:
Create publication-quality graphs with a user-friendly interface.
Choose from a variety of graph types, such as scatter plots, bar graphs, line graphs, and more.
Customize graphs with a range of formatting options, labels, and annotations.
Curve Fitting and Modeling:
Perform advanced curve fitting and modeling using a variety of built-in equations.
Explore dose-response curves, sigmoidal curves, and other mathematical models to analyze experimental data.
Survival Analysis:
Conduct survival analysis for time-to-event data, such as Kaplan-Meier survival curves.
Evaluate and compare survival distributions between different experimental groups.
Data Replication and Multiple Testing:
Assess the reliability of results through data replication and multiple testing options.
Implement corrections for multiple comparisons to maintain statistical integrity.
Reporting and Export:
Generate comprehensive reports with easy-to-understand summaries of analyses and results.
Export graphs and data in various formats, including PDF, JPEG, Excel, and more.
Integration with Other Software:
Integrate seamlessly with other statistical and graphing software, enhancing flexibility in data analysis workflows.
User-Friendly Interface:
GraphPad Prism features an intuitive interface that is user-friendly for both beginners and experienced researchers.
The software guides users through the analysis process, providing step-by-step assistance.
Updates and Support:
Regular updates ensure compatibility with the latest technologies and research methodologies.
GraphPad offers excellent customer support, including documentation, tutorials, and a user community.
Publication-Quality Output:
GraphPad Prism enables researchers to produce high-quality figures suitable for publication in scientific journals.
Broad Applicability:
Widely used in various scientific disciplines, including biology, pharmacology, biochemistry, and environmental science.
GraphPad Prism stands out as a comprehensive and user-friendly software tool for researchers and scientists in need of robust statistical analysis and graphing capabilities. Its versatility, intuitive interface, and extensive feature set make it an invaluable asset for those conducting experiments and studies across diverse scientific domains. Whether analyzing complex datasets, creating visually appealing graphs, or preparing results for publication, GraphPad Prism remains a trusted companion for professionals seeking accuracy and efficiency in their scientific endeavors.
GraphPad Prism - Changelog:
This release fixes multiple issues present in Prism versions 10.2.0-10.2.2, including an issue in which a file corruption may occur if the system folder that Prism uses as its working directory is write-protected.
Size: 186.38 MB
How to use GraphPad Prism:
GraphPad Prism is a powerful software for scientists to analyze and visualize their research data.
Here's a breakdown to get you started:
Learning the Interface:
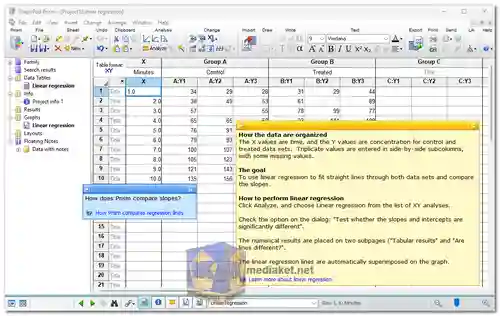
- Welcome Screen: When you first open Prism, you'll encounter a welcome dialog. Here, you can choose to create a new project with various data table and graph options or open an existing file.
- Data Table Types: Prism offers eight different data table structures, each suited for specific data types. Understanding these is crucial for efficient data entry and analysis.
- Navigator and Family Panels: These panels help you organize your project. The navigator on the left shows all sheets (data tables, graphs, etc.) in your project, while the family panel displays sheets linked to the currently selected sheet.
Data Input and Analysis:
- Entering Data: You can directly enter your data into the chosen data table or import it from a spreadsheet file.
- Performing Analysis: Once your data is in, Prism allows you to perform various statistical analyses. You can access these through the toolbar's "Analyze" button and choose the appropriate test based on your data type (e.g., t-test, ANOVA).
Creating Graphs:
- Data Link: Graphs in Prism are linked to data tables. Changes in the data table are automatically reflected in the graph.
- Customization: Prism offers extensive customization options for your graphs. You can change colors, add labels, and edit layouts to create publication-quality visuals.
Learning Resources:
Here are some resources to help you master GraphPad Prism:
- GraphPad Prism User Guide: [https://www.graphpad.com/guides/prism/latest/user-guide/how_to_learn_prism.htm]. This comprehensive guide covers everything from basic functionalities to advanced statistical analyses and curve fitting.
- Sample Data Sets: Prism provides sample data sets with each data table type. These allow you to follow tutorials and practice using the software.
Remember, these are just the initial steps. As you explore further, you'll discover the full potential of GraphPad Prism for your scientific data analysis and visualization needs.